
Clinical picture. M., a woman in her mid-forties, was referred eight months after the sudden death of her mother. She described feeling ashamed that she had laughed at her mother's funeral and had spent the first two months focused entirely on administrative tasks, only to find herself crying without warning in a supermarket some weeks later. She interpreted this delayed and fragmented response as evidence that she had not truly loved her mother. The clinician introduced the informational sheet on grief, walking through the section on individual variation and the body's delayed responses; M. recognized her own trajectory in the description of numbing followed by deferred emotional waves. By the following session she reported a measurable reduction in self-critical rumination, noting that having a name for her experience had made it feel less pathological.
The Grieving Process: PDF Worksheet, Tools and Exercises for Clinical Practice
A structured visual PDF worksheet with trajectory diagrams, clinical warning signs, and psychoeducation tools to explain the grieving process clearly in session.
Clinical vignettes
Normalising a Non-Linear Grief Response
Identifying Prolonged Grief Early
Clinical picture. T., a man in his late fifties, presented fourteen months after the death of his adult son, describing persistent disbelief that the loss had occurred and an inability to re-engage with work or social contact. He had been told repeatedly by family members that grief takes time, which had discouraged him from seeking help sooner. During a psychoeducation session the clinician used the three-trajectory diagram from the grief fiche, distinguishing the integrated course from the prolonged pattern; T. identified himself in the latter without prompting and expressed relief that the sheet framed this as a treatable condition rather than a personal failing. This reframe supported his agreement to a referral for a structured intervention targeting complicated grief.
Grief is one of the few presentations where a clinically accurate explanation can itself feel intrusive. Patients often arrive carrying either the Kübler-Ross stage model (still circulating heavily in popular culture) or no framework at all, and the gap between what they are experiencing and what they expect grief to look like generates significant secondary distress. This fiche PDF gives you a structured visual support to close that gap in session, without lecturing.
Use this resource with your patients
Handout, exercises and materials ready to use, right inside SessionFuel.
Why the Grieving Process Resists Oral Explanation
Oral psychoeducation about grief tends to fail in two specific ways. First, patients equate non-linearity with pathology: feeling steadier last week and then collapsing at a supermarket on a Tuesday reads as regression, not integration. Second, the cultural script around grief (fixed stages, clear timelines, "closure") actively competes with anything you say. Naming "integrated grief" or "complicated grief" verbally lands very differently from pointing to a diagram that shows both trajectories at once. The visual externalises the concept and makes the patient's own experience recognisable rather than exceptional.
This friction is especially present when your formulation needs to differentiate grief from depression. The distinction (yearning and person-focused longing vs. global anhedonia and harsh self-criticism untethered from the loss) is clinically precise but easy to lose in conversation, particularly when both are active simultaneously. Sharing a written reference stabilises the vocabulary across sessions and reduces interpretive drift on both sides. For clinicians working alongside a structured resource on depressive presentations, having a complementary grief-specific tool prevents conflation and supports more differentiated formulation.
What the Fiche Contains
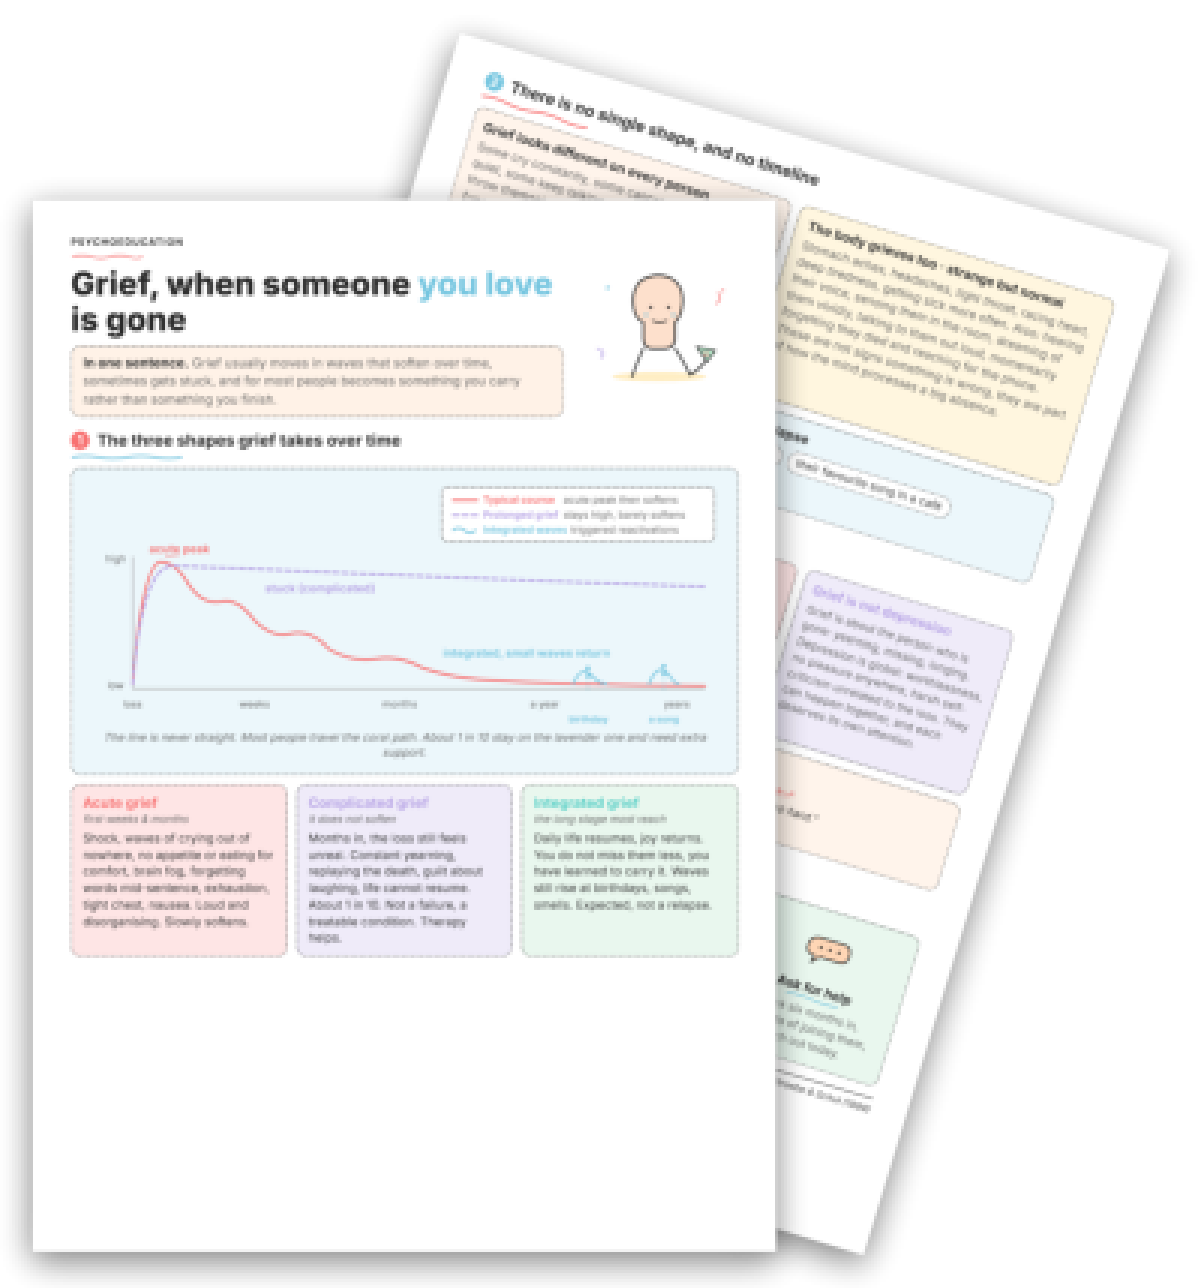
The fiche opens with a single orienting sentence: "Grief usually moves in waves that soften over time, sometimes gets stuck, and for most people becomes something you carry rather than something you finish." That sentence alone is worth sitting with in session before advancing to the diagrams.
The visual core is a trajectory graph (Panel 1) showing three labelled courses side by side: the typical acute peak that gradually softens, the prolonged/complicated course that remains elevated, and the integrated course marked by episodic reactivations. The "1 in 10" figure for complicated grief is embedded here, grounding the clinical threshold without pathologising the majority. This visual is particularly useful when introducing the formal criteria for Prolonged Grief Disorder, since you can point directly to the trajectory rather than invoking a diagnostic label cold.
Panel 2 maps the heterogeneity of grief presentations, covering numbness, somatic symptoms, sensory phenomena (hearing the deceased's voice, reaching for the phone to call them), and specific reactivation triggers, including birthdays, a song overheard in a café, a stranger wearing the person's perfume. Naming these concretely on paper validates what patients often hesitate to report. Panel 3 covers three practical columns: what helps acutely, warning signs that warrant specialised support ("persistent thoughts of joining them", life still frozen at six to twelve months, substance use to cope), and a direct side-by-side comparison of unhelpful phrases vs. gentler alternatives. Panel 4 distils four summary points the patient can reread between sessions.
> Key takeaway: This fiche is a visual support that facilitates in-session explanation of the grieving process. It is not a self-help handout to read alone at home; it is a shared reference you build from together, section by section, before the patient takes it away.
750+ clinical tools
A library built with and for clinicians, ready to use in session and extend between appointments.
Access all the toolsWhen and How to Introduce the Fiche
The fiche fits naturally in sessions two or three, once the presenting loss has been named and a working alliance is forming. It is especially useful when a patient arrives with a fixed timeline expectation ("I should be over this by now"), presents with somatic symptoms they do not connect to bereavement, or expresses confusion about their own pattern, for instance when reading common grief myths has left them more, not less, confused.
A low-inference introduction: "I have something I often use with people going through loss. It shows three different ways grief can move over time. I'd like us to look at it together and see which path feels closest to yours right now."
For patients where complicated grief is emerging, the trajectory diagram anchors the referral rationale more concretely than a label. The tasks of mourning framework and maintaining the bond in a changed form integrate naturally as the work deepens. When death anxiety is also present, the fiche may surface it; having a coping-strategies resource and grounding techniques nearby lets you respond to activation in the room without derailing the psychoeducation.
One genuine contraindication: in the very first weeks of acute bereavement, the trajectory graph can feel premature or abstractly clinical. In those sessions, common reactions to trauma or a sadness-focused psychoeducation program may be a more titrated entry point before introducing the fiche. For patients who have previously encountered the stage model, pairing this fiche with a direct discussion of what the stages framework gets wrong often clears more ground than either resource alone.
The fiche does not replace therapeutic formulation or the relational frame. It makes the explanation sharper and leaves the patient with a concrete reference they can return to without you.
Use it with your patients
Share this tool in the mobile app and follow the work between sessions.
Sources
- Worden, J. W. (2018). Grief Counseling and Grief Therapy: A Handbook for the Mental Health Practitioner (5th ed.). Springer Publishing Company.
Your session continues in your patients' pocket
Use with a patientYour resources, available everywhere
The handouts, exercises, programs and audios above: you choose which ones to make available to your patients, in the mobile app dedicated to them.
And far more than a library
The app goes well beyond resources, to support your patients every day:
Related categories
Explore other clinical resources by category.

Mood
Evidence-based worksheets and clinical tools for mood disorders: CBT, ACT, and positive psychology resources for psychologists and therapists.

Understand
Clinical hub for the therapeutic aim 'Understand': worksheets and tools to build patient insight across CBT, ACT, schema therapy and more.

Anxiety
Clinical hub for anxiety disorders: CBT and ACT worksheets, psychoeducation sheets, and exercises for assessment and treatment across the anxiety spectrum.

Trauma
Clinical hub on trauma and PTSD: assessment, differential diagnosis, treatment phases, and printable resources for practitioners. 155 chars.

Identity
Clinical resources for self-identity work in therapy: CBT, ACT, schema tools for clinicians addressing self-concept, core beliefs, and identity disruption.

Emotions
Clinical resources on emotion regulation: worksheets, coping tools, CBT, REBT, and ACT exercises for therapists working across diagnoses and age groups.